
Master QR Menu A/B Testing to Boost Revenue
Learn how to use A/B testing with digital QR menus to optimize pricing, descriptions, and layout for maximum restaurant revenue.
Why A/B Testing is Essential for Your Digital Menu
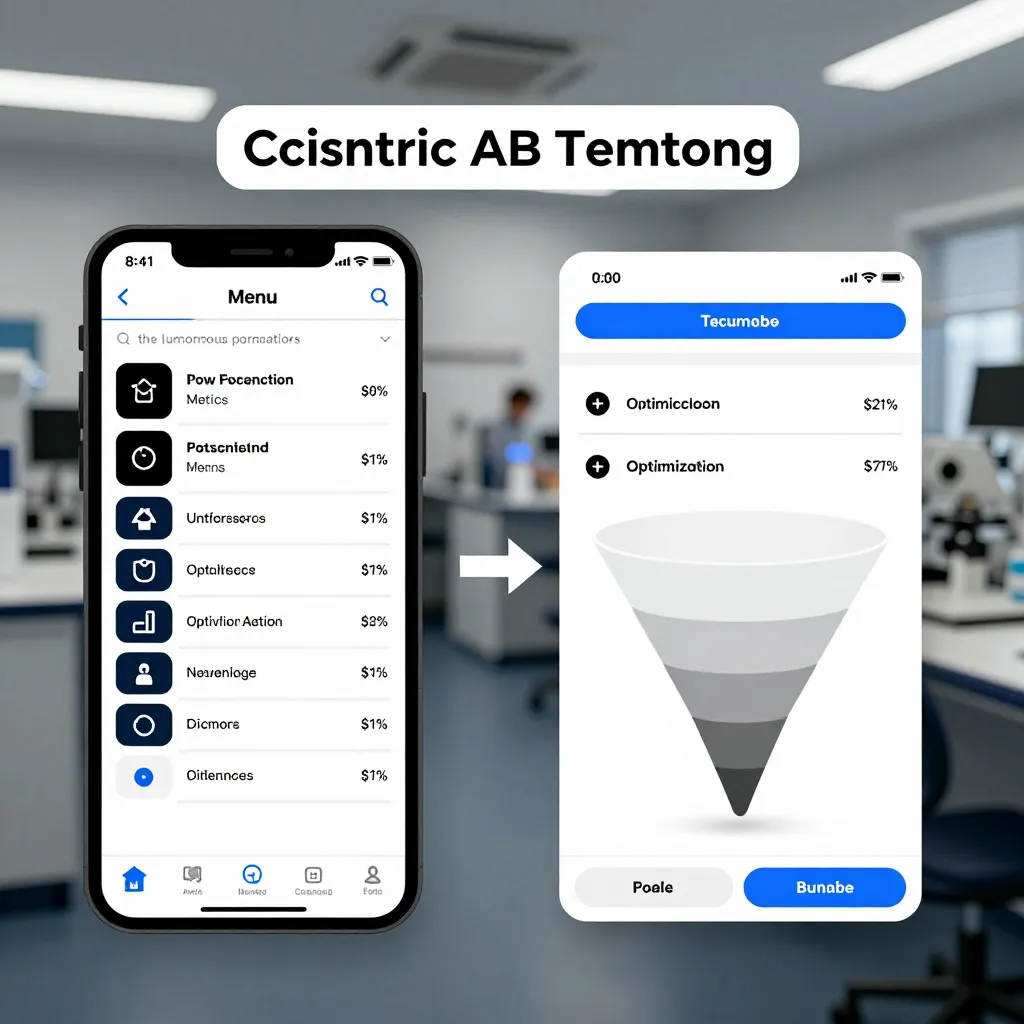
In the competitive landscape of modern dining, relying on intuition alone is no longer a viable strategy for revenue growth. Restaurant owners and cafe managers must leverage data-driven decisions to understand exactly what drives sales. This is where A/B testing, often called split testing, becomes a powerful tool. By presenting two versions of your digital menu to different segments of your audience, you can determine which elements perform better in real-world conditions.
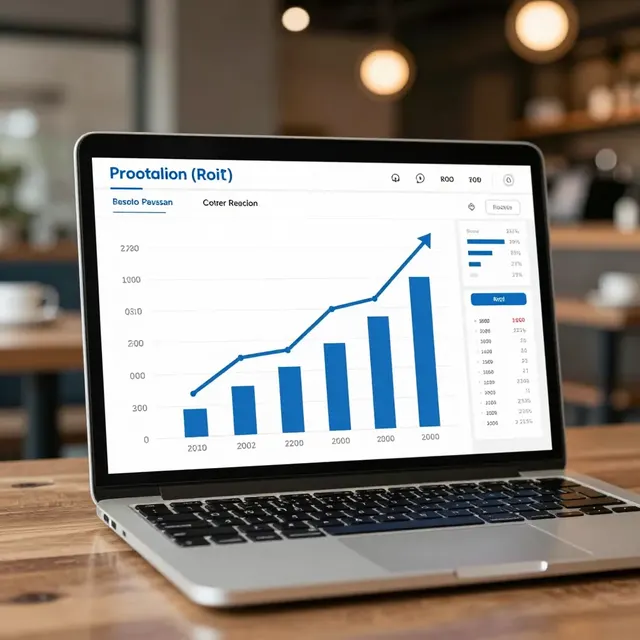
Unlike traditional paper menus, where changes are costly and slow to implement, digital QR menus offer the agility to test hypotheses instantly. You might wonder if the difference is significant. The answer is often a resounding yes. Industry data suggests that restaurants utilizing digital menu optimization see an average increase in food sales ranging from 15% to 25%. This revenue lift comes from increased average order value (AOV) and higher conversion rates on key menu items.
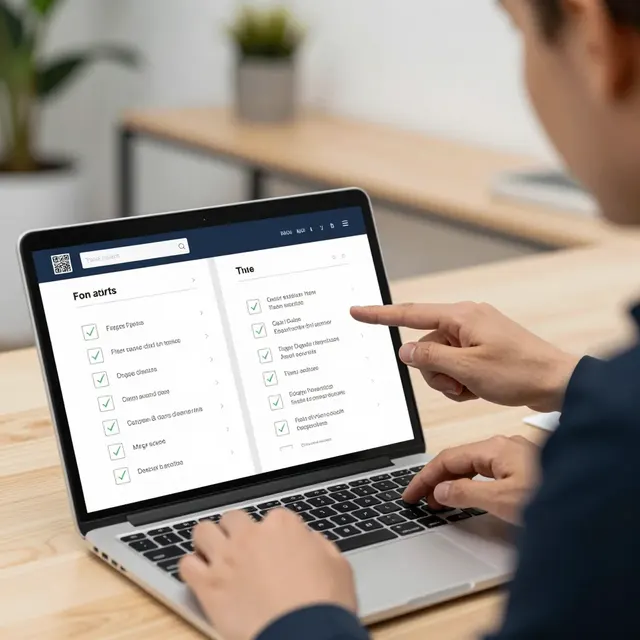
The core principle is simple: show Version A to Group X and Version B to Group Y. Measure the results. Did Version A generate more clicks on high-margin items? Did the new photography in Version B reduce decision paralysis? These insights allow you to refine your offering continuously, ensuring that every customer interaction is optimized for profitability.
Optimizing Menu Descriptions to Influence Purchasing Behavior
One of the most effective areas for A/B testing lies in the descriptive text of your menu items. The way you describe a dish can significantly impact a customer's perception of value and their willingness to pay a premium. Consider the psychology of sensory marketing. Words like "crispy," "smoky," or "freshly baked" trigger sensory responses that static images alone cannot achieve.
Here is a practical example of how to structure an A/B test for descriptions:
Version A (Standard): "Grilled Chicken Salad with Caesar Dressing."
Version B (Sensory-Rich): "Juicy grilled chicken breast marinated in herbs, served over crisp romaine with creamy house-made Caesar dressing and a hint of lemon zest."
When you run this test, you are not just changing words; you are testing the customer's imagination. Studies in food psychology indicate that detailed descriptions can increase the perceived value of a dish by up to 20%. Furthermore, this is where your commitment to transparency shines. You can test adding specific ingredient lists to see if it builds trust. For instance, Version A could list "Organic Spinach" while Version B lists "Locally Sourced Organic Spinach." Does the specific detail increase the likelihood of purchase? Often, customers who value sustainability and honesty are more likely to choose an item when they know the origin of the ingredients.
Another critical aspect to test is the inclusion of allergen information and dietary tags. While this is a legal requirement in many jurisdictions, framing it positively can boost sales. Version A might simply list "Contains: Wheat, Dairy." Version B could state, "Perfect for those avoiding gluten!" or highlight "Vegan options available." Testing these approaches reveals whether your customers prioritize safety information or convenience tags, allowing you to tailor your digital display to maximize conversion without compromising on honest and accurate information.

The Impact of Visual Layout and Item Placement
While descriptions capture the imagination, the visual layout of your digital menu dictates the flow of the customer's eye. In the world of digital menus, "position is power." The first few items a customer sees are often the first they consider ordering. A/B testing your layout can reveal the most effective way to guide customers toward high-margin items or signature dishes.
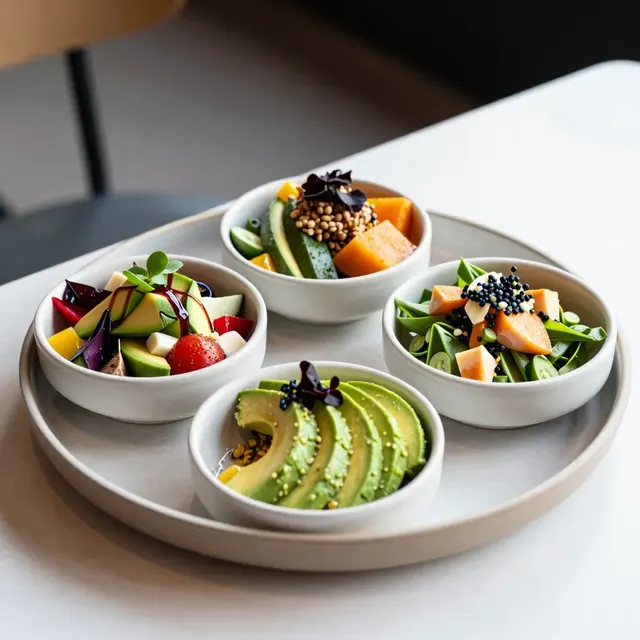
Consider testing the placement of your most profitable items. Version A might place your high-margin cocktail at the very top of the beverage section, while Version B places it at the bottom. Similarly, you can test the visibility of add-ons. Version A could list "Extra Cheese" as a standard option, while Version B might highlight it as a "Chef's Special" with a distinct icon. These subtle changes can significantly impact the average order value.
Another powerful test involves the use of icons and badges. Digital menus allow for dynamic elements that paper cannot offer. Version A might use a simple green checkmark for "Best Seller" items. Version B could use a pulsing animation or a star rating system. Does the visual urgency of an animated badge drive more clicks than a static label? Data often shows that customers respond well to social proof. Testing the inclusion of customer ratings next to dishes can reduce decision paralysis, a common issue where customers spend too long deciding and leave without ordering.
It is also vital to test the readability and navigation structure. Version A could be a long, scrolling list, while Version B could be categorized by meal type (Starters, Mains, Sweets). A cluttered menu can lead to frustration and lower sales. By testing different categorization methods, you ensure that every customer, regardless of their language or familiarity with the cuisine, can find what they want quickly. This aligns perfectly with our value of universal access, ensuring that your digital platform is inclusive and user-friendly for everyone.
Strategic Pricing and Upselling Techniques
Pricing strategy is perhaps the most sensitive area for A/B testing, but it is also one of the highest yield for revenue optimization. However, you do not need to change the actual price numbers to run a successful test. Instead, you can test how price presentation influences perception. This is known as the decoy effect.
Imagine you are selling a premium burger for $18. Version A presents this price alone. Version B presents the $18 burger alongside a "Value Meal" for $15 that includes a side and a drink. Version C might introduce a $22 burger with "premium truffle fries." By testing these configurations, you can see which arrangement makes the $18 burger appear more attractive. Often, introducing a slightly higher-priced option makes the mid-range option seem like a smart choice, increasing the volume of sales at your desired price point.
You can also test the effectiveness of bundling. Version A might list every item individually, allowing customers to build their own plate. Version B could offer a "Tasting Flight" of three appetizers at a discounted rate. Does the convenience of a bundle drive more orders than individual items? For many cafes, testing "combo deals" versus à la carte options reveals that bundles often increase the average check size by 20-30%.
Furthermore, test the visibility of discounts and loyalty rewards. Version A could show a "10% off your first order" banner prominently at the top. Version B might integrate the discount code directly into the checkout flow without a banner. Which method results in higher redemption rates? Remember, honest and accurate information is paramount. Never hide fees or use deceptive photos to make food look better than it is. Instead, test how transparently you present promotions. Customers appreciate clarity. If you offer a discount, show it clearly. If you have a limited-time offer, make the countdown timer visible. Trust builds loyalty, and loyalty drives repeat revenue.
Leveraging Data and Automation for Continuous Growth
The ultimate goal of A/B testing is not just to run a single experiment, but to build a culture of continuous improvement. With a digital QR menu platform like upQR, you have the infrastructure to automate this process. You can set up experiments to run over a week or a month, gathering thousands of data points to ensure statistical significance. Relying on a small sample size can lead to skewed results; a week-long test accounts for different days of the week, weather conditions, and customer demographics.
Once you identify a winning variation, it should become your standard configuration. However, the market is dynamic. What works in winter might not work in summer. Seasonal testing is crucial. You might test a heavy, comfort-food description in January and a light, fresh description in July. Your digital menu must adapt to these shifts seamlessly.
Automation also helps in personalization. If your platform allows for dynamic content based on time of day, you can test different menus for breakfast versus lunch. Version A could focus on savory options for breakfast, while Version B highlights sweet treats. Testing these time-based variations ensures that you are always offering the right product at the right moment.
Finally, always analyze the full funnel. Did the change in description lead to more orders? Did the new layout lead to fewer abandoned carts? Look at the metrics that matter: conversion rate, average order value, and customer retention. If a test shows a 5% increase in sales, that is a win. If it shows no change, do not discard the idea immediately; perhaps the sample size was too small or the duration was too short. Use these insights to refine your approach.
Conclusion: Empowering Your Restaurant with Data
Implementing A/B testing for your QR menu is a strategic investment that pays dividends in revenue and customer satisfaction. By systematically testing descriptions, layouts, pricing, and visual elements, you transform your digital menu from a static document into a dynamic sales tool. You gain the power to understand your customers deeply, offering them exactly what they want while maximizing your profitability.
At upQR, we believe in a system built on transparency, universal access, and honest information. Our platform provides the robust tools you need to conduct these tests easily, from A/B testing modules to real-time analytics dashboards. We eliminate the guesswork, allowing you to focus on what you do best: serving delicious food. Start testing today, and watch your restaurant's revenue grow with every digital interaction.
Related Posts
Ready to create your digital menu?
Create your QR menu in minutes and reach your customers in any language.