
QR Code Menu Analytics: Understanding What Your Customers Order
Unlock hidden insights with QR code menu analytics. Discover top sellers, optimize inventory, and boost revenue using data-driven decisions from your digital menu.
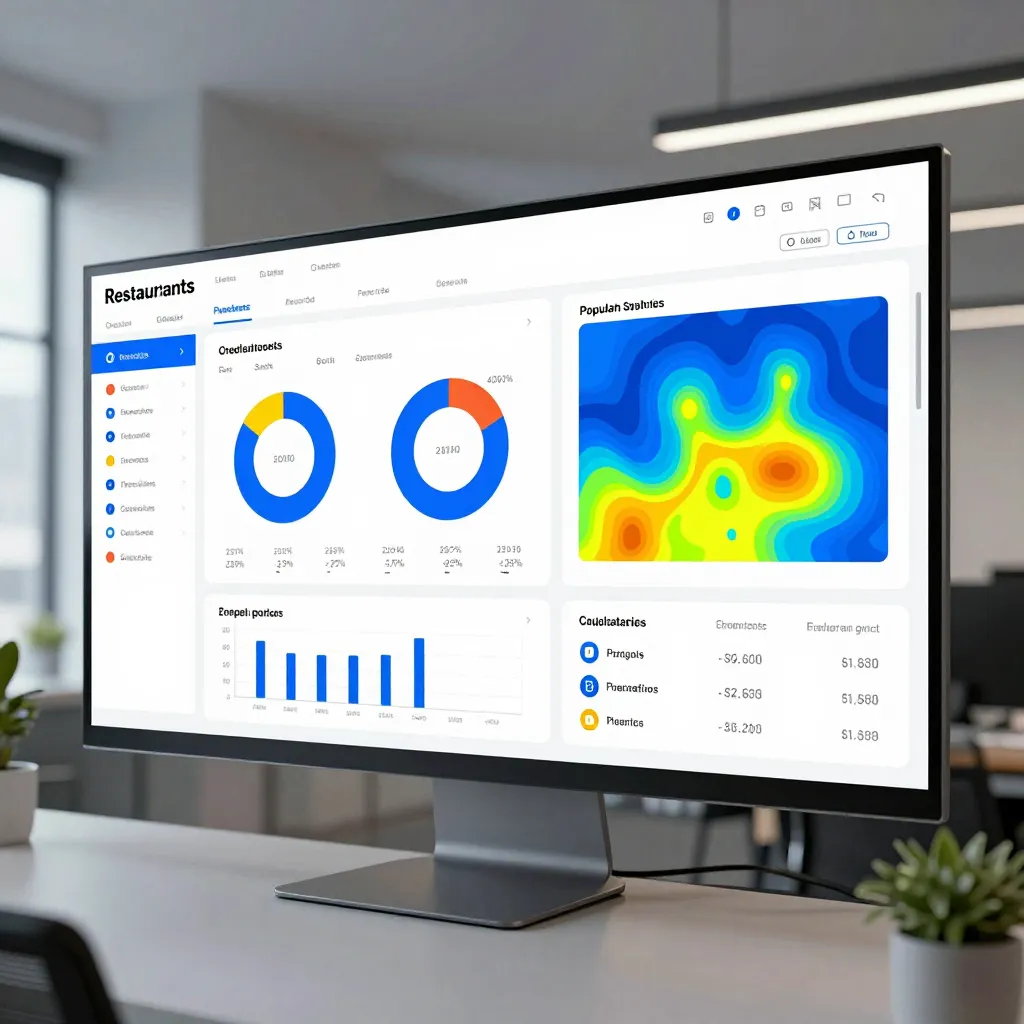
Why Traditional Menus Fail to Tell the Full Story
In the restaurant industry, intuition has long been the primary tool for making menu decisions. Owners often rely on anecdotal evidence, "the usual suspects" who visit regularly, or gut feelings about what dishes perform well. While these methods have merit, they lack the granularity and real-time accuracy required in modern food service. A traditional paper menu sits silently on a table, offering no feedback loop. You cannot see which item was ordered by the customer sitting in the corner versus the one at the booth. You miss the data entirely until the end of the shift, and even then, it is often lost in a pile of paper receipts or memory.
This lack of visibility leads to significant inefficiencies. Inventory waste occurs when high-margin items are over-ordered based on guesswork, while popular dishes are accidentally discontinued due to a single bad night. Furthermore, without data, it is difficult to identify seasonal trends or the impact of new menu items. For instance, a restaurant might introduce a "signature burger" expecting it to become a staple, only to find it gathering dust on the menu because no one ordered it. Without digital tracking, the owner never realizes the issue until the item is removed, wasting the marketing effort and ingredient costs already incurred.
The shift to digital solutions changes this dynamic entirely. By moving to a digital platform, you are not just replacing paper with a screen; you are installing a data collection system directly at the point of sale. This transition allows you to move from reactive management to proactive strategy. You begin to understand not just what customers order, but how they order it, when they order it, and how much they are willing to pay for different price points. This level of insight is the foundation of a profitable and sustainable business.
Decoding the Data: What Your Customers Actually Order
When you implement a digital menu system, the first layer of analytics you encounter is the breakdown of sales by item. This is far more than a simple list of what sold; it is a detailed map of customer preferences. Unlike a paper menu where you have to manually tally receipts, a digital system automatically aggregates data, categorizing sales into distinct metrics such as bestsellers, emerging trends, and underperformers. This immediate visibility allows you to make adjustments on the fly. If a new salad is underperforming on a Tuesday afternoon, you can tweak the description, add a photo, or adjust the price immediately, rather than waiting for the next inventory count.
One of the most powerful insights comes from understanding the "mix" of your orders. Do customers prefer lighter options in the summer and hearty comfort food in the winter? Digital analytics can reveal these seasonal shifts instantly. For example, a cafe might notice that 80% of their orders in July are cold brews and fruit bowls, while December sees a 40% spike in hot soups and pastries. This data empowers you to adjust your prep lists accordingly, ensuring you have the right ingredients on hand when demand is highest. This reduces food waste and maximizes profit margins.
Another critical aspect is the analysis of add-ons and modifiers. In a traditional setting, it is nearly impossible to track how many times customers add extra cheese, upgrade to a premium protein, or add a side. Digital menus can track these micro-decisions. You might discover that customers are consistently upgrading to "extra crispy" fries or adding avocado to their toast. Armed with this knowledge, you can highlight these high-margin add-ons in your menu design or create a specific "upgrade" promotion to encourage these behaviors. This turns small customer choices into significant revenue streams.

Optimizing Inventory and Reducing Waste
Food waste is one of the largest operational costs for restaurants, often accounting for 10-15% of total food costs. The primary driver of this waste is misalignment between inventory and demand. When you do not know exactly what is being ordered, you are forced to order conservative amounts of ingredients to avoid spoilage, which can lead to stockouts and lost sales. Conversely, over-ordering based on outdated data leads to spoilage. Digital menu analytics bridges this gap by providing precise demand forecasting.
Imagine a scenario where you introduce a new seasonal dish using a specific herb that is expensive and perishable. With a paper menu, you might order a bulk supply of that herb, only to find it rotting in the fridge because the dish didn't sell as expected. With a digital system, you can monitor the dish's performance in real-time. If the dish is not selling well in its first week, you can immediately reduce your order of that specific ingredient, preventing waste. If it becomes a hit, you can scale up your order confidently. This agility allows you to operate with leaner inventory, freeing up cash flow and reducing the environmental impact of your food service operations.
The data also helps you identify "silent killers" in your inventory. Sometimes, an ingredient is used across multiple dishes, but one of those dishes is failing, dragging down the overall usage of that ingredient. Analytics can show you the correlation between menu items and ingredient usage. You can see exactly which items are driving the consumption of your stock and which are dragging it down. This allows for strategic menu engineering. You might decide to remove a low-selling item that uses a high-cost ingredient, or replace it with a similar item that performs better, thereby optimizing your entire supply chain.
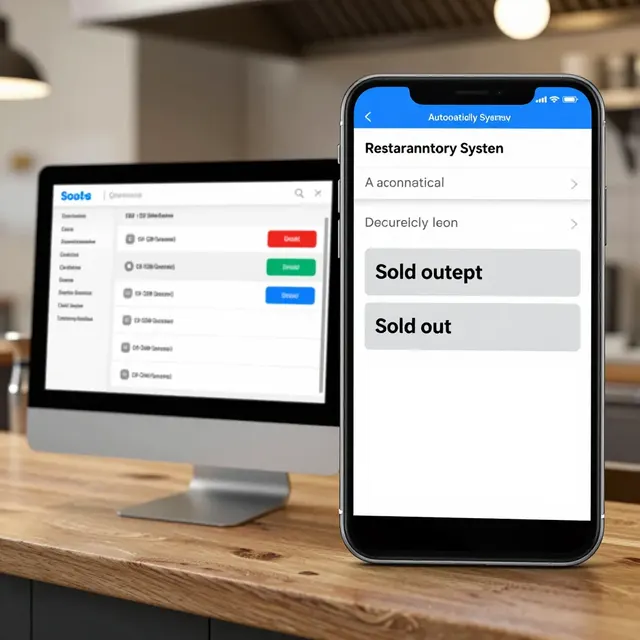
Enhancing Menu Engineering and Pricing Strategy
Menu engineering is the practice of analyzing menu items to maximize profitability. It involves plotting items based on their popularity (sales volume) and their profitability (food cost). Traditional methods of doing this are slow and prone to error. Digital analytics automates this process, providing a clear visual representation of your menu's performance. You can instantly identify "Stars" (high popularity, high profit), "Plowhorses" (high popularity, low profit), "Puzzles" (low popularity, high profit), and "Dogs" (low popularity, low profit). This classification is crucial for strategic decision-making.
Once you know where your items fall on this matrix, you can make data-driven adjustments. For "Stars," you might want to ensure they are always available and perhaps even create a signature status around them. For "Puzzles"-items that are profitable but not popular-you can investigate why. Is the description unclear? Is the price too high? Or do you simply need to promote them more aggressively? Analytics can show you that a specific item has a high margin but low sales. You might then decide to feature it in a daily special or bundle it with a popular item to increase its visibility and sales.
Pricing strategy also benefits immensely from this data. You can analyze the price elasticity of your products. Does a 10% price increase on a popular item significantly reduce sales? Or does a small price adjustment on a less popular item increase revenue without a noticeable drop in volume? Digital tools can simulate these scenarios or show you historical data to inform these decisions. You might find that customers are very sensitive to the price of coffee but less so to the price of a sandwich. This insight allows you to adjust your pricing structure to maximize revenue without alienating your customer base. It transforms pricing from an arbitrary decision into a strategic lever for growth.
Real-World Example: The Coffee Shop Transformation
Consider the case of "Bean & Brew," a local coffee shop struggling with inconsistent sales and high waste. They switched to a digital QR menu platform to gain better insights. Within the first month, the owners noticed a surprising trend: their cold brew was a bestseller, but they were still using a standard paper menu that didn't highlight it effectively. The analytics showed that customers were ordering cold brews but often forgot to add ice, leading to inconsistent product quality and customer complaints. The owners used the data to create a specific prompt on the digital menu: "Add extra ice?" which increased the frequency of this add-on.
Furthermore, the data revealed that their pastry section was underperforming on weekdays. The analytics showed a clear dip in sales between 10 AM and 2 PM. Instead of discarding the pastries, the owners adjusted their marketing on the digital menu, offering a "Weekday Pastry Deal" during those specific hours. Sales for that section increased by 25% within two weeks. They also used the data to see that a specific muffin variety was consistently under-ordered. They removed it from the digital menu, reducing waste by 30% in a single month. This simple shift from guessing to knowing allowed them to save money and improve customer satisfaction simultaneously.
Actionable Steps to Leverage Your Menu Data
To get the most out of your digital menu analytics, you must actively use the data rather than just collecting it. Start by setting a weekly review routine. Spend 15 minutes every Friday looking at your top and bottom performers. Ask yourself: "Why did this item sell well?" and "What can I do to improve the underperformers?" Use the insights to make small, incremental changes. If you notice a specific spice is running low because a popular dish is selling out, reorder immediately. If you see that a certain time of day has low engagement, consider running a flash sale or a limited-time offer during that window.
Another key step is to segment your data. Look at sales by location if you have multiple branches, or by day of the week. You might find that your downtown location prefers quick, hot meals, while your suburban location prefers casual, family-style dining. Tailoring your menu descriptions or even your inventory allocation based on these segments can significantly boost performance. Do not be afraid to experiment. Use the A/B testing features available in many digital platforms to try out different menu layouts or descriptions. See which version generates more clicks and orders. This iterative process of testing and learning is the fastest way to optimize your menu.
Finally, share these insights with your team. When your servers understand that a certain dish is a high-margin item that customers love, they can confidently recommend it. Training your staff to use the data helps them become better upsellers. If the analytics show that customers are asking for a specific modification frequently, like "no onions" or "extra sauce," ensure your kitchen is prepared for it. This alignment between the front of house, back of house, and data team creates a cohesive operation that responds quickly to customer needs.
By embracing digital menu analytics, you are not just tracking sales; you are building a smarter, more responsive business. You gain a competitive edge by understanding your customers better than your competitors who are still relying on paper. The ability to pivot quickly, reduce waste, and optimize pricing gives you the flexibility to thrive in a challenging market. Tools like upQR provide the infrastructure to make this happen, offering robust analytics that are easy to understand and act upon. Start collecting data today, and watch your restaurant transform into a data-driven success story.
Related Posts
Ready to create your digital menu?
Create your QR menu in minutes and reach your customers in any language.