
Q3 Restaurant Analytics: Key Digital Menu Metrics for Owners
Discover the essential digital menu metrics every restaurant owner must track in Q3. Learn how data drives decisions, boosts sales, and simplifies operations.
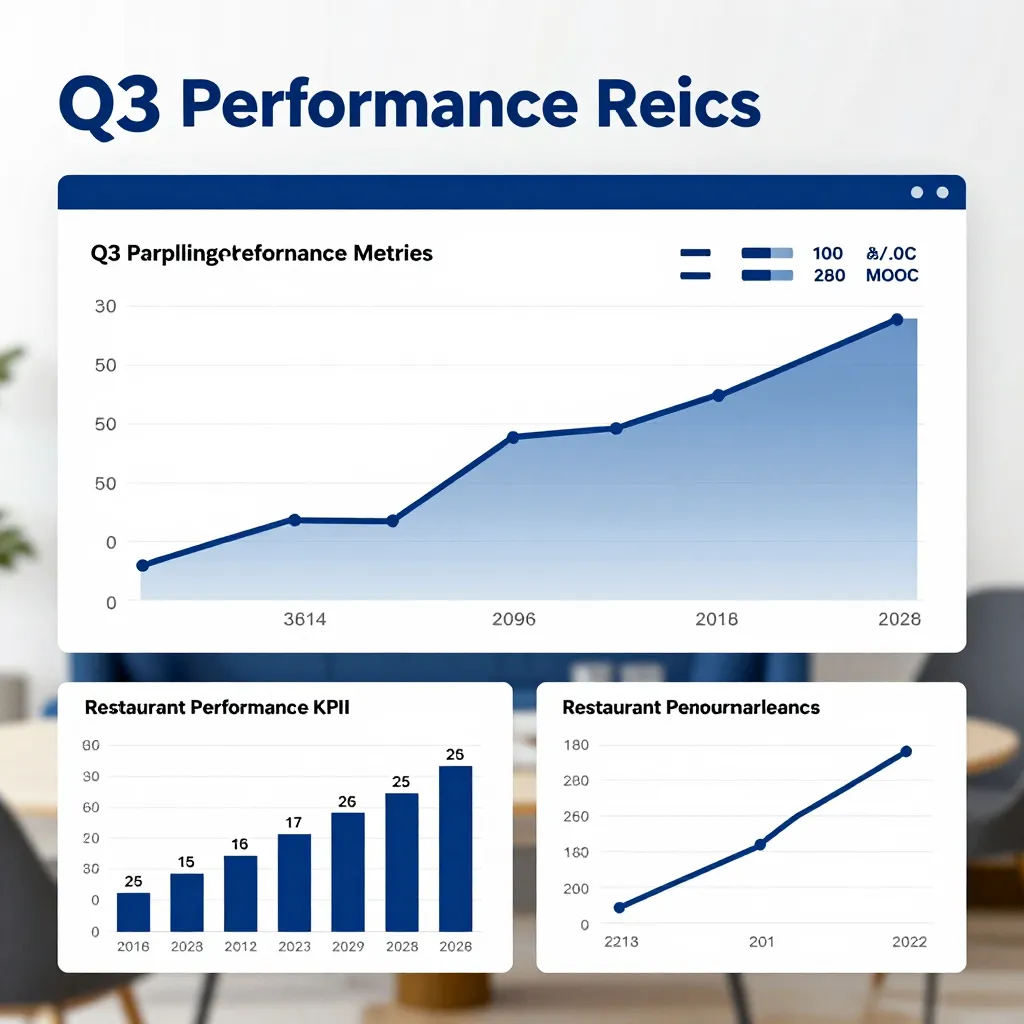
Why Q3 Analytics Matter for Your Restaurant's Bottom Line
As we move through the third quarter of the year, restaurant owners and cafe managers are shifting focus from mere survival to strategic growth. The summer season has tested your operations with high traffic, weather fluctuations, and evolving customer expectations. Now, the time has come to analyze the data collected during these busy months to prepare for the fourth quarter and beyond. Unlike traditional paper menus, digital QR menus powered by platforms like upQR generate a wealth of actionable data that paper cannot. This data isn't just about counting sales; it is about understanding customer behavior, optimizing inventory, and enhancing the dining experience.
In the hospitality industry, intuition is valuable, but data is king. According to industry reports, restaurants that leverage digital tools for analytics see a significant increase in operational efficiency. By reviewing your Q3 metrics, you can identify which dishes were your true stars, which times of day yield the highest margins, and where you might be losing potential customers due to friction in the ordering process. The goal is to transform raw numbers into a clear roadmap for profitability.
Furthermore, the post-pandemic dining landscape has normalized digital ordering. Customers expect speed, clarity, and transparency. If your digital menu lacks these features, you risk losing orders to competitors who offer a smoother experience. Analyzing how customers interact with your digital menu-how long they spend on it, which items they scroll past, and how often they use filters-provides insights that directly impact your conversion rates. A seamless digital experience reduces wait times and allows your kitchen to prepare orders more efficiently, directly correlating to increased throughput and higher revenue.
Menu Performance: Identifying Winners and Fixing Losers
One of the most immediate benefits of a digital QR menu is the ability to track item-level performance in real-time. With a paper menu, you only know a dish is a winner after it is fully cooked and paid for. With a digital system, you can see exactly which items are being clicked, viewed, and ordered. This granularity allows for rapid menu engineering.
Start by categorizing your items based on two primary metrics: popularity and profitability. High popularity and high profitability items are your "stars" and should be prominently featured. Conversely, items with low popularity and low profitability are "dogs" and should be considered for removal or replacement. However, the nuance lies in the middle. Some items may be popular but have low margins due to ingredient costs. These are "plowhorses" that drive traffic but hurt the bottom line. Others might be profitable but rarely ordered; these are "puzzles" that need marketing or placement adjustments to boost their visibility.
Consider the real-world example of a local cafe that noticed their signature latte was popular but had a low margin because of the cost of imported beans. By adjusting the recipe slightly or sourcing beans locally, they improved the margin without sacrificing taste, a change they could track instantly via their digital menu analytics. Additionally, you can track seasonal trends. Did your summer specials perform well in July but fail in August? This data helps you plan your Q4 menu, ensuring you capitalize on fall ingredients like pumpkins or apples before the season ends.
Another critical aspect is the analysis of add-ons and modifiers. Digital menus make it easy to see which toppings or customizations are most requested. If 40% of customers add extra cheese or a specific sauce, this indicates a strong demand that might justify a permanent menu addition or a specific promotion. Conversely, if a specific modifier is rarely selected, it might be confusing or unnecessary, cluttering the menu and slowing down the order process. Streamlining these options based on data can significantly speed up kitchen prep time, reducing the likelihood of errors and improving customer satisfaction.

Customer Behavior and User Experience Optimization
How customers interact with your digital menu tells a story about their experience and expectations. When a user scans a QR code, they are entering your digital storefront. Their journey from scan to order completion is critical. Metrics such as "time on page" and "scroll depth" can reveal where users are getting stuck or losing interest. If customers spend a long time on a specific item's page, they might be reading the description carefully, which is a good sign of engagement. However, if they bounce quickly, it could indicate that the loading speed is too slow, the design is unappealing, or the information provided is not transparent enough.
Transparency is a core value of modern dining. Customers want to know exactly what they are eating, including ingredients and allergens. If your digital menu lacks this information, or if the photos are misleading, you risk negative reviews and lost trust. Analytics can help you identify if customers are using the "Allergen Filter" frequently. If this feature is underutilized, you might be missing an opportunity to serve customers with dietary restrictions who feel safe and informed by your honest labeling. If it is overutilized, you may need to ensure your allergen data is as accurate and up-to-date as possible.
Another key behavior to monitor is the use of language filters. In an increasingly diverse community, offering multiple languages in your digital menu can expand your customer base. Track which languages are most used. If Spanish or Mandarin filters are heavily accessed, it suggests a significant demographic in your area that you are currently underserving. Addressing this need can open up new revenue streams and foster a more inclusive dining environment. Remember, a universal access approach ensures that every customer, regardless of their background, feels welcome and informed about their meal.
Visual hierarchy also plays a massive role in behavior. Analytics can show which items are clicked most often. Often, the first item in a list or the item with the highest-quality photo receives the most attention. Use this insight to strategically place your high-margin or new items in these prime spots. However, avoid cluttering the menu. A clean, uncluttered design that focuses on the food helps customers make decisions faster. Slow decision-making leads to longer wait times, which can frustrate customers and reduce table turnover rates.
Operational Efficiency and Inventory Management
The data generated by a digital menu extends far beyond sales figures; it is a powerful tool for inventory management and operational efficiency. By tracking ingredient usage at the item level, you can predict demand with greater accuracy. Traditional forecasting often relies on historical sales data that may not account for current trends or special events. A digital menu allows you to see real-time trends, helping you adjust your purchasing orders to minimize waste and maximize freshness.
For instance, if your analytics show a spike in orders for a specific dish during a particular week, you can anticipate the need for more specific ingredients. Conversely, if an item is trending down, you can reduce your stock of its key components, preventing spoilage. Food waste is a significant expense for restaurants, and digital analytics offer a direct way to combat it. By aligning your inventory with actual customer demand, you support environmental sustainability while saving money. This aligns perfectly with the environmentally conscious mission of modern businesses like upQR, where reducing paper waste is just the beginning of a broader commitment to a greener future.
Operational efficiency also involves understanding peak times and staff allocation. While general POS data covers this, digital menu data can reveal specific friction points. For example, if orders placed via the digital menu during lunch rush take significantly longer to process than those placed by waitstaff, it might indicate a need for better training on the digital interface or a need to simplify the menu options during those times. Streamlining the ordering process ensures that your kitchen isn't overwhelmed by complex customizations during the busiest moments.
Furthermore, digital menus can facilitate promotions that drive specific inventory turnover. If you have an excess of a particular ingredient, you can create a limited-time offer in your digital menu to highlight dishes that use it. Because the menu is dynamic, you can update these offers instantly without reprinting anything. This agility allows you to respond to market conditions quickly, ensuring that your kitchen is always running at optimal capacity without over-ordering perishable goods.
Preparing for Q4: Using Q3 Data to Plan Ahead
As you wrap up your Q3 review, the ultimate goal is to use these insights to prepare for the fourth quarter, which often includes holiday rushes and special events. Your Q3 analytics should inform your Q4 strategy in several ways. First, review your menu engineering results. Are there any items that consistently underperform? It is better to remove them before the holiday season begins than to waste valuable kitchen space on dishes that customers do not want. Replace them with seasonal favorites that will appeal to the holiday palate, such as comfort foods or festive specials.
Second, consider your marketing strategy based on customer behavior. If your data shows that customers are highly engaged with your sustainability initiatives or transparency features, highlight these in your Q4 marketing campaigns. Share stories about how your digital menu reduces waste or how you source ingredients locally. Authenticity resonates with modern diners, and leveraging this data builds brand loyalty. You can also use the insights from your language filters to ensure your holiday messaging reaches a broader audience, perhaps by adding holiday greetings or special offers in the languages most frequently used by your digital menu visitors.
Finally, use the inventory data to negotiate better terms with suppliers for the upcoming quarter. If you have successfully reduced waste in Q3, you can present this data to suppliers to justify larger volume discounts or better pricing on key ingredients. This financial leverage can significantly improve your margins in Q4. Additionally, if you have identified specific operational bottlenecks, such as slow loading times on your digital menu during peak hours, address these technical issues before the holiday rush. A smooth, fast digital experience is essential for maintaining high customer satisfaction during the busiest times of the year.
The transition from Q3 to Q4 is a critical juncture for any restaurant. The data you have gathered in the summer months provides the clarity needed to make confident decisions. By focusing on menu performance, customer behavior, and operational efficiency, you are not just reacting to the past; you are proactively shaping the future of your business. Embracing these digital tools empowers you to run a more sustainable, transparent, and profitable establishment. This is where upQR shines, providing the robust analytics and digital infrastructure needed to navigate the complexities of modern hospitality with ease and confidence.
Related Posts
Ready to create your digital menu?
Create your QR menu in minutes and reach your customers in any language.